HaHa:
HaHa: 
 Reply With Quote
Fish
Lots of fish.
Can you put a speed display box on your graph?
I'm guessing you were moving slow with the T motor.

 Keeper

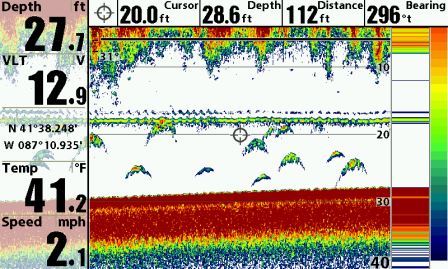
Was fishing today and seen this in different places on the water is it just trash or some fish. I played with my settings and this is about as good at it gets any help is appreciated.
Sent from my iPhone using Crappie.com
Trophy King
Fish
Lots of fish.
Can you put a speed display box on your graph?
I'm guessing you were moving slow with the T motor.
Keeper
Thanks. No sir its just a sonar but I was going slow .3-.5 when I took the pics. So speeding up would make them arch better?
Sent from my iPhone using Crappie.com
Slabmaster II
That looks like fish to me. They look like that if your going slow (0-1.5 mph) They look like arches if your going faster over them.
Sent from my SM-N950U using Crappie.com Fishing mobile app
BigDawgg LIKED above post
Trophy King
So speeding up would make them arch better?
Yes and depending on unit, a faster chart speed will shorten the arches
The boat was trolling into the waves so the bottom and the fish are somewhat jagged in the first pic, but also longer due to the slow speed.
This was due to the boat surging and stalling.
The second pic was smooth trolling at a higher speed.
Both shots give you examples of various sonar returns.
The solid line in pic 2 is a downrigger ball and the thinner line just above it is the lure attached to the ball.
Notice the thinner line is somewhat jagged as that is the lures action as it moves around in the water.
Crappie Wall Hanger II
So in the picture above, you’re running at 2.1 mph; what would you set your chart speed at?
Trophy King
The rule of thumb is usually chart speed= boat speedSo in the picture above, you’re running at 2.1 mph; what would you set your chart speed at?
I usually have my chart speed set at 3 or 4 and leave it because I am familiar with the shortness or elongation of the hooks depending on too little or too much speed.
Also run 3-4 mph when scouting with side imaging so I just leave it set and adjust my interpretation.
Slower speed than chart speed equals a longer arch and faster equals a shorter arch and the same with the chart speed adjustment.
Time on the water and you will start to see it.
If I saw what you had on your graph, I would have dropped a bait down there and tried to catch one.
Never know what species it is unless you try, and if you catch one, you now have some experience in interpretation of your particular unit's sonar returns.
Good luck
Jwater thanked you for this post
Posting Permissions